EGU 2014 Day 4 – Global catastrophes, uncertainty and can you ever know your audience?

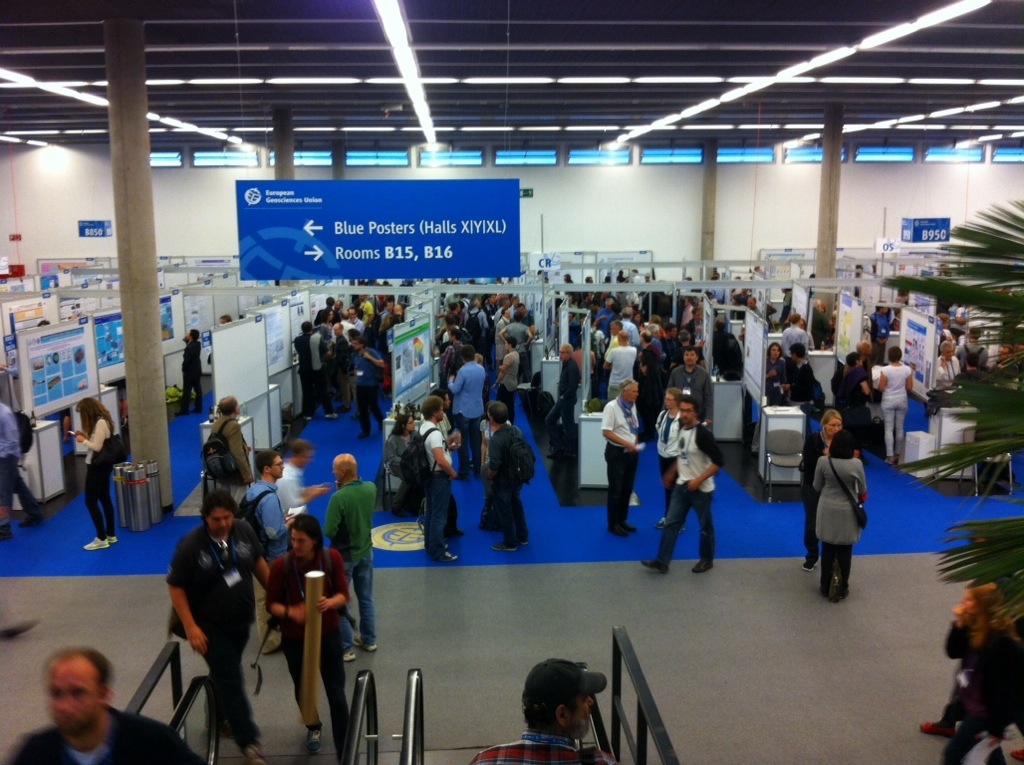
Day four in the big geology house…. Today started well, I took a little time in the morning to work on my presentation for tomorrow, but because I forgot to reset the clock on my computer I missed the workshop on applying for funding that I was aiming to attend. Nevertheless I made it to my first session of the day ‘Volcanism, Impacts, Mass Extinctions and Global Environmental Change‘ (SSP1.2/GMPV41) which is a session that has to win the prize for BEST NAME OF A SESSION EVER. I bumped into a lecturer from my University there, who seemed a little surprised to see me – he asked why I was there and I said ‘Global catastrophes? Of course I’m coming to this one!’ and he replied that he was there for the isotopes. Strangely the organisers seemed to underestimate the interest factor of such an epic session title, and had put the session in a really small room. People were crammed in all over the place, sat on the floor, standing by the walls, and every seat was full. You just can’t deny the pulling power of massive disasters.

20140506-135504.jpg

The talks themselves were great, a series of presentations on Tunguska and the Siberian trap flood basalts and their associated infrastructure. There were questions of whether magamatism could trigger a mass extinction, and if the dates of massive flood basalt eruptions did actually precede the extinctions? Seth Burgess did actually present data that suggested the main body of the eruptions did actually commence AFTER the extinction, but also recognised the problem of sampling bias – a common problem in the geological sciences – that you can’t always get the data you want because, oh, a mountain is on top of it. So you have to predict as best you can based on incomplete data. From the data that Seth Burgess had, he suggested that there was more than one phase of the eruption and that the lavas that couldn’t be sampled may actually contain sills that predate the extinction.

20140506-135731.jpg

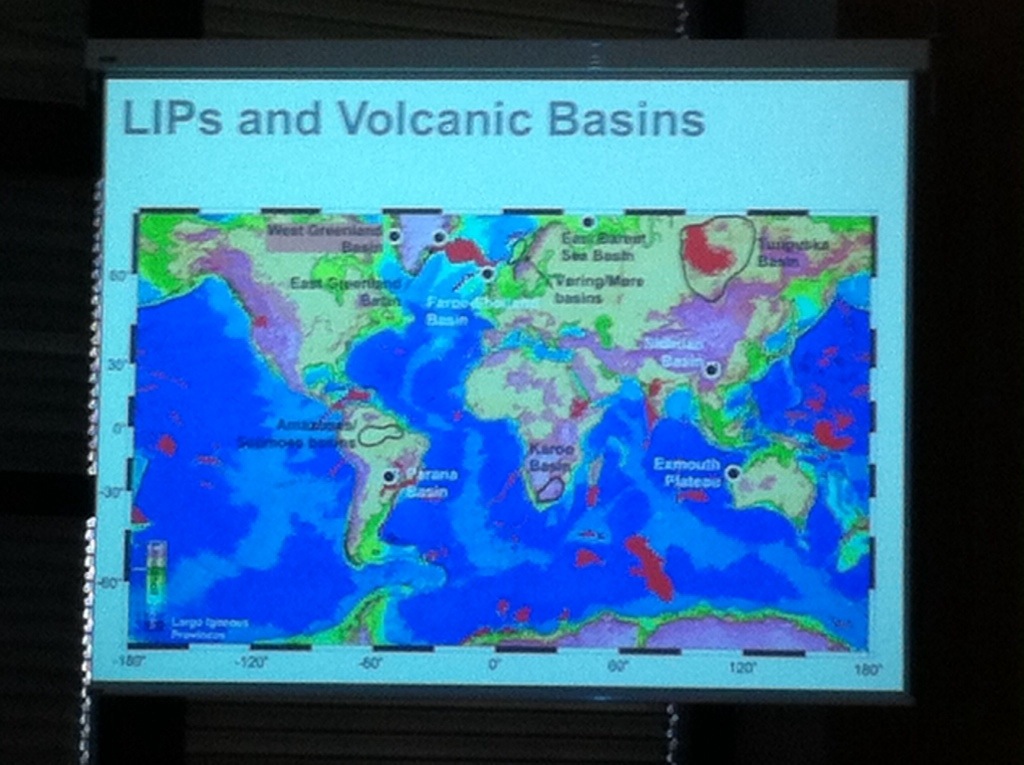
Later on the session, the extinction moved from the end-Permian to the Cretaceous. Now if you are unfamiliar with that name – think dinosaurs. It’s the one where the famous film should really have been called Cretaceous Park instead (and why it wasn’t I really don’t know!). The thing with the end-Cretaceous extinction was that it happened not only at the same time as a massive flood basalt, but at the same time as a massive (and famous) meteorite impact called Chixulub. Mark Richards from the University of California, Berkeley, told us that there was a 1 in 5 chance of all of these events being a coincidence, which isn’t really that bad. But when you include the size of the Deccan eruptions, the chance becomes 1 in 50, so it is hard to dismiss this as a coincidence. He suggested that another reason for the correlation, was that the impact could have triggered massive worldwide magmatic activity – in the same way that seismic triggers have been shown to induce magmatic activity on a much smaller scale. A question was asked however, if there was any evidenced for this systemic increased activity and although at the moment there is not, Professor Richards thinks that geochemical data could be available to support this hypothesis.

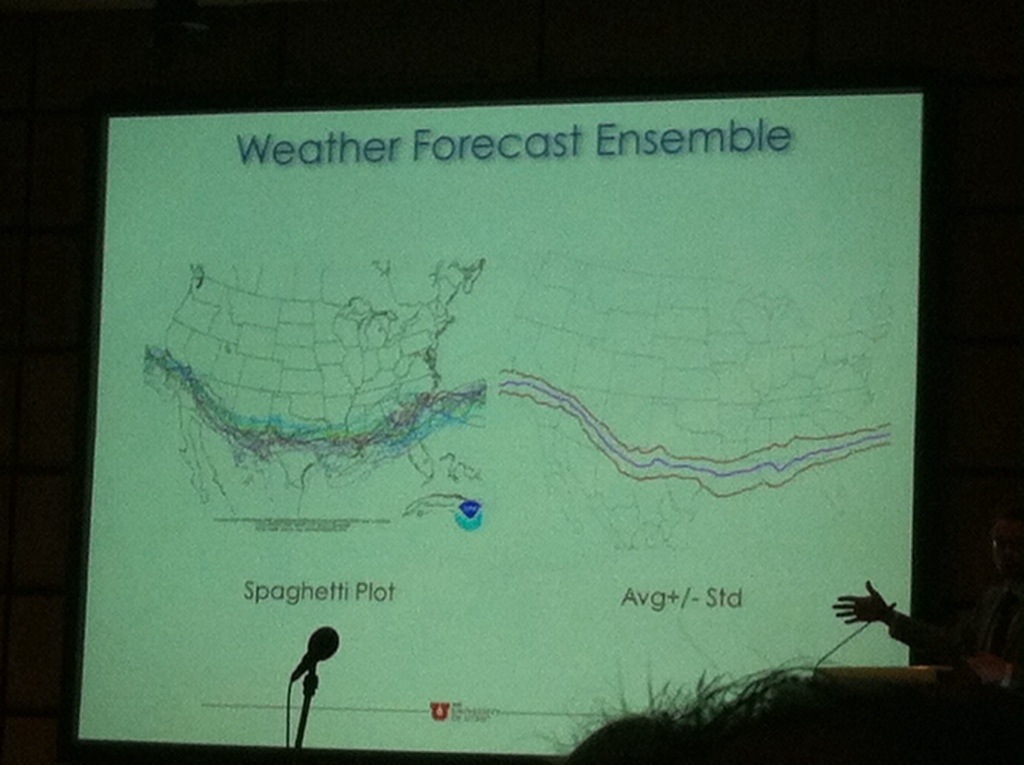
So from volcanoes and massive meteorite impacts I thought I would move on to uncertainty and the ‘Communication of Uncertainty about Information in Earth Sciences‘ (SSS11.1/ESSI3.6), convened by R Murray Lark from the BGS. This session was all about how we, as geoscientists, represent unceratinty. This is a really big deal, especially when you relate it to what I was saying above about sampling bias – a large amount of geological information is interpreted on, what the researchers would see as, less than perfect data sets. Now a lot of uncertainty work is based on how to represent a statistical analysis of the uncertainty to other geologists, but there is a growing interest in how we represent uncertainty to the public. Robert Kirby talked about how using ensemble data (think hurricane tracks) can help people to understand different types of data simultaneously, but by using means and standard deviation statistical analysis you can extract more meaningful data (which may be harder to understand). What was interesting to me, was the suggestion that non-experts would have a better understanding of the value of ensemble data that statistically analysed data, but this hadn’t been tested yet. In fact a lot of the work on public understanding of uncertainty seemed to be based upon assumptions – so perhaps these were initial results of studies that were ongoing.

20140506-135916.jpg

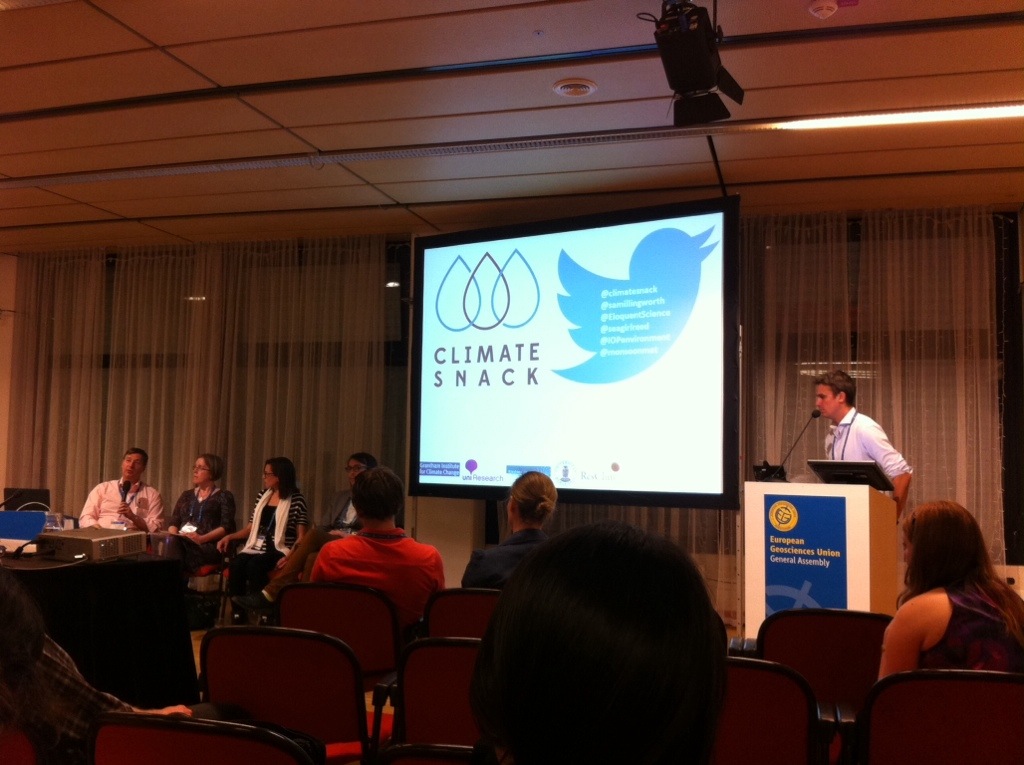
The day ended with the Townhall meeting ‘You don’t know your audience! A ClimateSnack debate‘ (TM8). This meeting drew together a number of science communications experts from a variety of backgrounds to discuss ‘knowing your audience’ a central concept in sci comm and one that is often under debate. The panel consisted of:

Dr Sam Illingworth, a lecturer in Science Communication at Manchester Metropolitan University (read more about him here)
Christina Reed, an independant science journalist
Liz Kalaugher, from environmentalresearchweb
Prof David Shultz, a lecturer in Synoptic Meteorology at Manchester University and the author of Eloquent Science
Mathew Reeve, co-founder of ClimateSnack (the moderator)

The discussion covered a wide range of subjects relating to audience – can you ever know your audience, how do you know what your audience wants, where is ‘the room’ in a digital age? We even discussed the seemingly opposing views of should we even be attempting to communicate all forms of science (as some parts are genuinely too difficult to understand without four years of university education) and do we seek to maintain the ‘aura of mystery’ to preserve our academic importance? What was interesting here was the idea that as science communicators we all WANT to communicate every aspect of our science, but that is just unrealistic – and most people genuinely wouldnt care. What we have to do is make our science AVAILABLE instead.

20140506-140031.jpg

Finally I asked about training our undergraduates in science communication and Prof Schultz raised an interesting point – that our undergraduates often have a hard enough time writing scientifically first and that writing for a general audience from a scientific perspective – especially as a scientists – often means you need to understand scientific writing before you can communicate it back to the public. Also, he said, in his experience students already think they can communicate with non-scientists without training!

This session finished at 8, so I trundled myself back to the hostel to prepare for my oral presentation tomorrow at 9.15am (eek!).

20140506-140327.jpg

How to use a geological map (or where to find an ammonites armour).

When you go fossil hunting, one of the most important things to do is to know what you are looking for. There is no point in looking for a Mammoth skull in a place where the geology is not old enough for Mammoths to be buried there. It’s the same idea as not going fishing in a desert (though geologists sometimes find fish in deserts, but that’s another story). No, in order to know what fossils you expect to find, you need to know about geological maps.

Geological Maps of Britain 1:625 000 Scale BGS

These maps show the bedrock geology – the geology under the soil – for Scotland, Wales, Engand and a bit of Northern Ireland (sorry – overlap is obscuring most of NI)

This is a geological map of Britain. You may realise that it looks a lot like a normal map, except that instead of roads and countryside it has strange bands of colour swirled across it. These bands of colour represent the geology, but I’ll get to that in a minute. First you need to find out where you are on the map.

For argument’s sake I am going to choose Whitby, because I know that is a good place for fossil hunting, but you could start by looking where you live, or somewhere you really want to go looking for fossils (by the way if you don’t have a geology map of your own and can’t find one in your library you can use the digital one on the British Geological Survey website – it’s not as detailed, but you get lots of great extras).

The geology of Whitby

This shows a close up of the geology around Whitby.

So take a closer look at your area. As you can see in this photo the colours on the map around Whitby are:

  • A purpley brown with the letters J1 written in the space
  • An orangey beige with the letters J2-3
  • A light purple with J4
  • A yellow with J5

Which is all well and good, but what does it mean? And how does this help us find our ammonite? Well just to give us context, if we zoom out from Whitby a bit you can see that the nearby area also has greenish bits with ‘K’s on them and pinkish-orange bits with ‘T’s on them.

The geology between Hartlepool and Flamborough Head

This map has zoomed us out a little bit to show some of the other colours in the area.

To find out what this means we need to look at the legend at the side. This is like the key and tells you lots of useful information. Let’s start with what the colours mean.

BGS Bedrock Geology North UK 1:625 000 legend

This is the legend for most of the rocks on this map (there is more but I couldn’t fit it easily on one image)!

Well the first thing that I always notice when I look at the legend of the map is that the colours are all arranged roughly together (there are oranges, blue-greens, beiges, and purples), and that the letters are grouped together as well. So if we think about the ‘J’ letters we were looking at, you can see that they are in the purple-brown section and are linked to an era called Jurassic. This is the geological age of the rocks in this area – it means that all the rocks with a J on them are Jurassic.

This word will probably be familiar to you if you go fossil hunting because here in this country we get a lot of fossils from the Jurassic – including ammonites! So we know we are on the right track. If we look around the Jurassic section, you can see those pinkish-orange colours by the big T are related to the Triassic and the greenish colours above with the K are related to the Cretaceous. Now although you can find fossils in these areas they are a bit far from Whitby, and I think we will find some interesting fossils in the Jurassic age rocks; let’s stick with them.

Zoom in on the legend

This is close up of the part of the legend that relates to Whitby on the map.

So going back to Whitby, if we want to find some fossils we need to know what kind of rocks to look for. Now to start out at the basic level, we already know we need to find a rock made of sediments (mud, sand, clay etc – the sedimentary rocks) because any rock that has crystals in it (like a granite or a marble) can’t have fossils (those are the igneous and metamorphic rocks). I’ll go into that more later, but first we are thinking about Whitby. So if I look back at my map I can see that the rocks immediately around Whitby are purpley brown with J1 on them. If I read that section of the legend it says:

Early Jurassic {  J1   Lias Group  mudstone and limestone

Ok well the first part (Early Jurassic) is just telling us the age of the rocks. This means these rocks are the oldest in the Jurassic period – if you look to the left a little you can see that the Jurassic started approximately 200 MILLION YEARS AGO!! The second is our letter that led us here. The third is the geologist’s name for these rocks – the Lias Group – it helps geologists to link different rocks together and match them across different parts of the country. The fourth part is the most helpful. Mudstones and limestones.

Shale with bivalves and ammonites

This is a type of mudstone – a shale – with lots of little fossils in it.

This tells us the type of rocks we are looking for – mudstones are stones made of mud (obvious huh?) that are brilliant at preserving fossils and limestones are rocks that are pretty much made of fossils. As a quick guide, mudstones are usually grey (especially in this part of the country) and form lots of layers in rocks. They can look a bit like slate but are very easy to break apart. Limestones can be grey, white or cream coloured depending on the fossils, but fossils in them can be pretty small and sometimes are really broken up, so we are going to focus on the mudstones.

So we know where we want to look – Whitby – what era the rocks will be – Jurassic, specifically Early Jurassic – how old they will be – about 200 million years old (specifically between 201-175 million years old) – and what type of rocks we are looking for – mudstones.

So when we go searching here do we know what kind of fossils to expect to find? AMMONITES! Just like Dactylioceras. This means we probably aren’t going to find a mammoth skull here, the rocks are too old! Same for looking for desert rocks, these rocks are too young for that period of our history. So by looking at a geological map you can know what type of fossils you should expect to find.

Geological maps are useful for lots of other things too, but I just want to go back to those bands of colour we saw on the first image. If you are really interested in finding ammonites, but had already looked in Whitby; a geological map can show us where in the country to find rocks of the same age (Jurassic) or type (Lias Group). You see that big purple swathe across the country down to Dorset? Those rocks are all Jurassic. So in theory you could find ammonites anywhere along that line! But remember only some places are safe to collect in, so check before you go running off to your nearest patch of purple-brown!

One final thing to point out is that if you live in certain places you aren’t going to find any fossils. These are places that have igneous or metamorphic rocks and you can spot them on your map initially by looking for the big red blobs.

Igneous provinces in the Lake District

These big red blobs mark where volcanoes used to be and are a sure fire way to find some brilliant rocks and minerals – but no fossils.

Although you are not going to find any fossils in the red blob areas you will find some fantastic volcanic rocks and some amazing and even sometimes really rare minerals and crystals.

If you want to find out more you can check out the British Geological Survey‘s webpage, they have loads of info on the maps they make and even lots of digital ones you can take with you. Check out this pamphlet they produce as well for more in depth information.

BGS - A short Guide to Geological Maps

This pamphlet on geological maps is produced by the BGS.

So there you have it – maps, a geologist’s best friend – and that is how you find an ammonites armour.

Have a rockin’ day!

(this post was moved from my old site, so sorry for any inconsistencies)